7 min to read
This week I want to talk about something that’s going to cause genuine panic inside marketing teams over the next few weeks. I’ve already seen it start happening with a couple of our clients. Dashboards are turning red. Performance looks like it fell off a cliff. Conversations are being had about pausing campaigns, pulling budget, and “figuring out what broke.”
Nothing broke.
What happened is that Meta quietly changed how it defines and counts conversions — and if you don’t understand the change, your instinct is going to be exactly wrong. You’ll pull budget at precisely the moment you should be holding firm. And while you’re retreating, the smarter players in your space will be quietly scooping up market share at a lower cost.
Let me explain what’s actually going on, and why this is one of those rare moments in paid media where staying calm is literally a competitive advantage.
What Meta Changed (And When)
In March 2026, Meta rolled out a significant change to how it attributes conversions in Ads Manager. The change sounds technical — and it is — but the real-world impact is straightforward: a lot of conversions that used to show up under “click-through” attribution no longer do.
Here’s the history. Before March 2026, Meta’s definition of a “click” was broad. If someone liked your ad, left a comment, saved the post, or interacted with it in any way — and then converted within the attribution window — that counted as a click-through conversion. Most advertisers didn’t realize this. They assumed click-through meant someone clicked the link, went to their website, and bought something. That’s a very different behavior from leaving a comment and then buying a week later. But Meta was bundling both into the same metric.
The March 2026 change separated these. Now:
Click-through attribution means exactly what it sounds like — someone clicked the link in your ad (to your website, your lead form, your app store listing) and converted. Nothing else qualifies. Likes, shares, saves, comments, profile taps — none of those count as click-through anymore.
Engage-through attribution is the new category that catches everything else. It covers all non-link clicks on your ad — the social interactions — plus video views of at least five seconds. If someone engaged with your ad without clicking through, and then converted within one day, that’s now reported separately as engage-through.
The default attribution setting in Ads Manager is now: 7-day click, 1-day engage-through, 1-day view-through.
And here’s the critical part that’s causing all the confusion: billing has not changed. Meta has been explicit about this. There is no change to how you’re charged, how your campaigns are delivered, or how bidding works. This is purely a measurement reclassification. Your actual results may be identical to last month. Your dashboard numbers are telling a different story.
Why Your Numbers Look Wrong Right Now
I want to make this concrete with a real scenario, because the abstract version doesn’t quite capture how disorienting this feels when you’re looking at it for the first time.
Let’s say you were running a campaign last month with what appeared to be 150 purchase conversions at a €12 cost per purchase. That looked great. You were happy. The client was happy. Now, this month, with identical spend and identical creative, you’re seeing 90 conversions at a €20 cost per purchase.
Your first instinct is going to be: something changed with the campaign. Creative fatigue. Audience saturation. A competitor entered the space. iOS changes. Something.
But here’s what actually happened: 60 of those 150 conversions you were counting last month were social-interaction-driven conversions — people who liked or shared the ad and then bought later. Those conversions still happened this month. They’re just now showing up under “engage-through” attribution, reported separately, with a one-day window instead of seven days. Some of them may have fallen outside that one-day window and may not be appearing in your dashboard at all.
The actual business outcome — the number of people who bought your product — is probably very similar. The dashboard just isn’t showing you the full picture in the same way anymore.
I’ve written before about how GA4 has attribution blind spots that cost marketers budget by making them think things aren’t working when they are. This Meta change is a different flavor of the same problem. The measurement layer and the reality layer are being confused.
The Opportunity Hidden in the Panic

Here’s where I want to be direct, because I think this is the most important thing I can say: the marketers who don’t understand this change are going to pull budget. They already are.
I had a conversation last week with a founder who manages his own Meta spend — mid-size e-commerce, serious budgets, has been profitable on Meta for three years. He was furious. His cost per purchase had “doubled” overnight. He was planning to pause everything while he “figured out what happened.” I spent twenty minutes on the phone explaining the attribution change. By the end, he understood that his actual sales volume hadn’t declined. He was looking at a reporting artifact.
But here’s the thing — he’s not alone. This same conversation is happening in thousands of marketing teams right now. Budget is being cut. Campaigns are being paused. CPMs will drop as auction pressure eases. And for anyone who stays the course, the economics are about to get noticeably better.
This is not a theoretical opportunity. This is the kind of moment that separates agencies and marketing teams that truly understand the platforms they operate on from those who are running on intuition and dashboard readings. At Codedesign (https://codedesign.org), we’re actively advising clients to hold budgets and, in some cases, lean in — because the evidence suggests we’re entering a window where the cost of reaching the same audience is about to decrease.
A Client Case Study: Reading the Dashboard Correctly
One of our e-commerce clients — a European consumer goods brand with a substantial Meta presence — noticed the change in early March. Their campaign manager flagged a significant drop in reported purchases and wanted to pause their best-performing ad sets.
Before making any changes, we did something simple: we cross-referenced the Meta data with their actual backend sales numbers. Orders placed during the same period. Revenue recorded in their Shopify dashboard. Conversion data from their CRM.
The gap was significant. Meta’s Ads Manager was now showing roughly 30% fewer conversions than in the previous month. But their actual sales — real orders, real money — were down just 4%, which was within normal week-over-week variance for their business.
We walked them through what had happened: the engage-through conversions that were previously folded into the click-through number were now either appearing separately or falling outside the one-day engage-through window. The purchases still happened. They just weren’t being counted the same way.
The decision was to hold spend and, in fact, increase budget on their highest-performing creative by 20%. Over the following three weeks, as some of their competitors began pulling back spend (we can infer this from CPM trends), their reach efficiency improved. The same budget was delivering more impressions and more actual sales.
This is what it looks like to play offense during a platform change rather than defense.
What You Should Actually Do Right Now
I’m going to give you the practical playbook, because “understand the context” without “here’s what to do” is not useful.
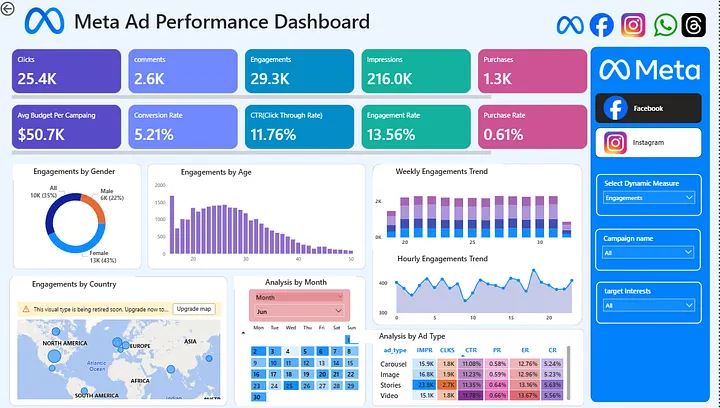
Reconcile your data with backend reality. Before making any campaign decisions, compare your Ads Manager conversion numbers with what’s actually happening in your CRM, your Shopify, your analytics platform, your actual business. If there’s a gap between what Meta is reporting and what your business is recording, the attribution change is probably the explanation. Don’t optimize toward a measurement artifact.
Set up the Compare Attribution Settings view. Meta now lets you view results across different attribution windows side by side. This feature is genuinely useful — it lets you see how your results look under 7-day click versus 1-day click, and it lets you look at engage-through conversions separately. Spend thirty minutes learning this view. It will tell you a lot about where your conversions are actually coming from.
Check your engage-through column. In Ads Manager, add the engage-through conversion column to your reporting view. This is where the missing conversions from your old click-through number went. If you’re seeing a significant volume here, you know your campaigns are still generating genuine interest — the traffic just isn’t being counted the same way.
Don’t optimize toward engage-through at the expense of click-through. Engage-through conversions reflect social interaction, not direct purchase intent. They’re interesting data, but they shouldn’t be the primary metric you’re optimizing for. You still want people clicking through to your site and converting. Use the engage-through data for context, not as your North Star.
Hold budget if your backend data supports it. If your actual sales numbers are holding steady while your Ads Manager numbers decline, this is a reporting issue, not a performance issue. The instinct to cut budget is understandable but wrong. If anything, it may be a moment to increase investment as competitors retreat.
The Broader Pattern to Pay Attention To
I want to zoom out for a second, because this isn’t the first time a platform measurement change has caused marketers to misread their own performance. It won’t be the last.
A few years ago, iOS 14 triggered a similar panic. Reported Meta results collapsed. Many brands dramatically cut their social ad budgets. The ones who understood that the measurement had changed (while consumer behavior largely hadn’t) gained significant market share during that window.
The pattern is almost always the same. Platform makes a change. Dashboards look worse. Uninformed marketers react to the dashboard. Informed marketers react to business outcomes. The gap between the two groups widens.
I’ve been reading a lot recently on this — Jon Loomer’s breakdown of the new Meta attribution settings is genuinely excellent technical reading if you want to go deep on the mechanics. I’ve also been following conversations on Voice of Experts (https://voiceofexperts.com), where this topic has come up repeatedly: the best performance marketers are the ones who can distinguish between a measurement problem and a performance problem. That skill is more valuable than ever right now.
The meta-lesson — no pun intended — is that platform literacy is a genuine competitive advantage. Knowing what the numbers actually mean, rather than just what they look like at face value, is increasingly what separates brands that grow from brands that react.
The Bottom Line
Meta’s attribution change is real. Your dashboard numbers look different. Some of the conversion volume you were reporting is now classified differently, with a shorter window, or not appearing at all in the default view.
Your actual business results are likely far more stable than your dashboard suggests.
The marketers who panic and pull budget will create an opening. The marketers who hold — or lean in — will benefit from reduced auction pressure and better reach efficiency during exactly the window when their competitors are retreating.
We’re advising clients to treat this as a buying opportunity, not a crisis. Reconcile your data, understand what’s actually being measured, and make decisions based on business outcomes — not dashboard readings.
If you’re not sure how to read your current Meta attribution data, or you want to make sure your campaigns are set up correctly after the March changes, we’re happy to talk it through at https://codedesign.org/contact-codedesign/. Sometimes one conversation is all it takes to separate a measurement problem from an actual performance problem.
What are you seeing in your Meta dashboards right now? Has the attribution change triggered conversations in your team about pulling budget, or are you holding steady? I’d genuinely like to hear how different teams are navigating this — drop a comment below or connect with me directly.

Add comment ×