8 min to read
Advanced Analytics: Measuring What Matters in B2B DemandGen
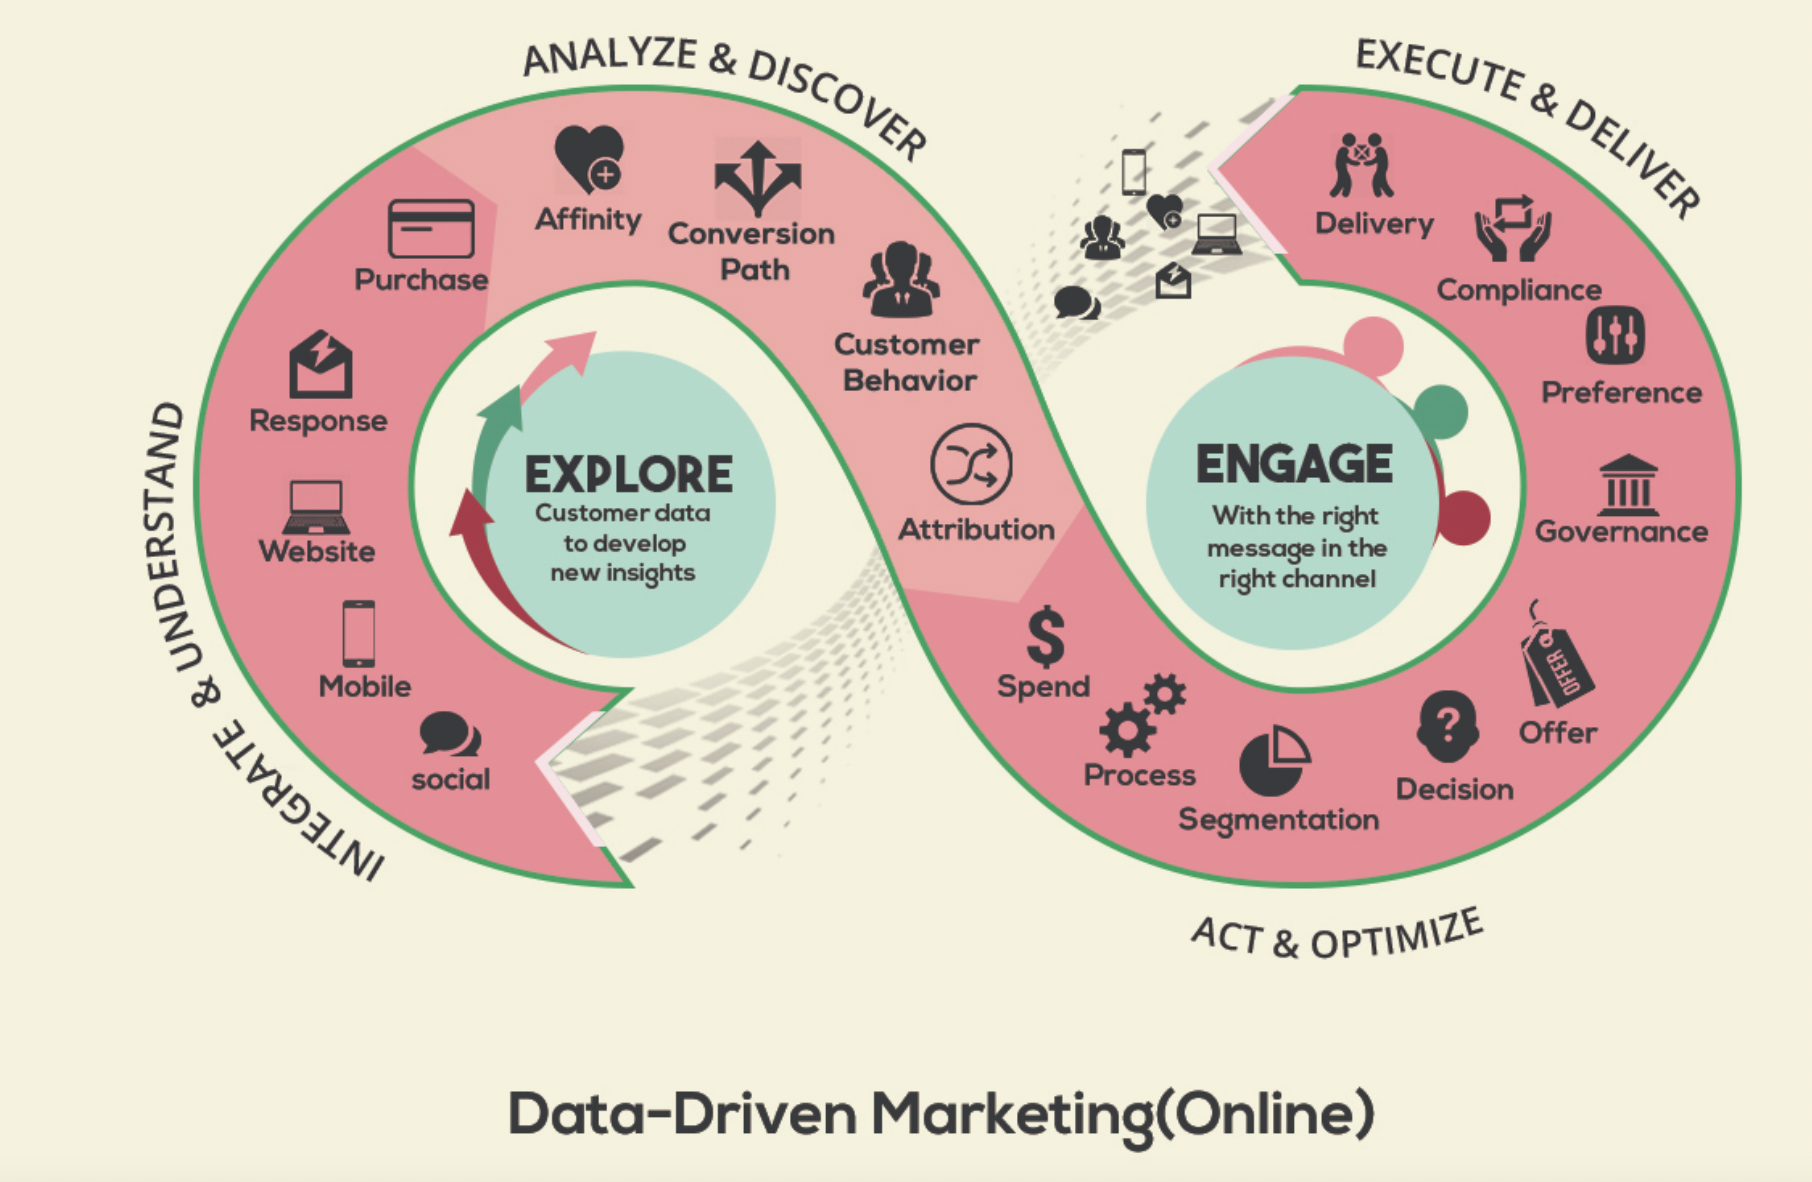
By integrating advanced analytics into our DemandGen strategies, we ensure that every marketing effort is directly tied to the broader goals of the business, such as increasing market share, driving revenue growth, or enhancing customer loyalty. For example, we use advanced analytics to analyse customer behaviour and market trends to identify potential areas for business expansion or product development. This data-driven approach allows us to tailor our marketing campaigns to target new customer segments or geographic markets that align with the company's growth objectives.
Additionally, advanced analytics enables us to measure the effectiveness of our DemandGen activities in real-time, allowing for quick adjustments to optimise performance. For instance, if data shows that a particular campaign is not performing as expected, we can immediately tweak our strategies—be it through adjusting the messaging, the channels used, or the target audience—to better align with our desired business outcomes.
You could work with us, the leading digital marketing agency in Lisbon, Portugal.
Focus on metrics like lead quality and buyer journey
It is crucial to recognize the importance of metrics such as lead quality and buyer journey progress. This shift is crucial because focusing solely on the volume of leads doesn’t necessarily translate to increased revenue or successful marketing outcomes. In contrast, analysing lead quality and the progress leads make through the buyer journey allows us to refine our marketing strategies and improve both the efficiency and effectiveness of our campaigns.
For instance, we measure lead quality by evaluating factors such as the lead’s engagement with our content, the completeness of their profile information, and their actions that indicate buying intent, such as downloading a whitepaper or attending a webinar. These indicators help us assess whether a lead is likely to convert into a paying customer. By prioritising high-quality leads, we can allocate our resources more effectively and increase conversion rates.
Furthermore, tracking the progress of leads through the buyer journey gives us insights into which stages of the journey are most prone to lead drop-offs. This understanding enables us to optimise each stage of the journey to ensure a smoother transition for potential customers from awareness to decision. For example, if we notice a significant drop-off at the consideration stage, we might introduce more detailed comparative content or case studies to help leads evaluate our offerings against their needs.
Utilise predictive analytics to ensure better campaign economics

We utilise predictive analytics to forecast future trends and behaviours for our B2B clients by analysing historical data and applying machine learning algorithms. This approach allows us to anticipate changes in the market, customer behaviour, and business outcomes, which in turn enables our clients to make proactive, data-driven decisions.
The process begins with data collection. We gather a broad set of data from various sources, including customer interactions across digital channels, sales data, and external market indicators. This comprehensive dataset forms the foundation of our predictive models.
Next, we clean and prepare the data for analysis, addressing issues like missing values or data inconsistency, which are crucial steps to ensure the accuracy of our predictions. Once the data is ready, we apply machine learning algorithms. Depending on the specific needs and the nature of the data, we might use regression models to predict numerical outcomes, such as sales volumes, or classification models to predict categorical outcomes, such as customer churn.
For example, for a client in the manufacturing sector looking to predict sales for the upcoming quarter, we would use historical sales data, along with external factors like market trends and economic indicators. By applying a regression model, we can forecast sales figures based on these inputs, allowing the client to adjust their production schedules and marketing strategies accordingly.
Finally, we continuously refine our models based on new data and outcomes to improve accuracy. This iterative process ensures that our predictive analytics remain relevant and valuable as market conditions and client needs evolve.
Lead quality scores would help prioritise follow up actions
Lead Quality Scores are a crucial component in refining the efficiency of a sales process, particularly at CodeDesign, where we prioritise optimising every marketing and sales action for effectiveness. Lead scoring involves assigning a numerical value to each lead based on various criteria that reflect their potential to become a customer. This scoring is based primarily on two factors: engagement and fit.
Engagement refers to how actively involved the lead is with our marketing efforts. This can include metrics such as email opens, clicks, website visits, and interactions on social media. A high engagement score indicates that the lead is interested and actively consuming the content we provide, which suggests a higher likelihood of progressing through the sales funnel.
Fit measures how well a lead matches our ideal customer profile. This is determined by analysing demographic data, such as industry, company size, job role, and geographic location, as well as psychographic factors like their specific needs or pain points. By combining these scores, we can prioritise follow-up actions effectively. Leads with high scores in both engagement and fit are considered 'hot' leads and are prioritised for immediate follow-up, as they have the highest potential for conversion. This prioritisation helps our sales team focus their efforts where they are most likely to yield results, ensuring that time and resources are spent on the leads most likely to close.
Conversion Rate Optimization Across Funnel Stages
Analysing conversion rates from initial contact to closed sale is essential for assessing the efficiency of marketing campaigns, where we aim to optimise every aspect of our customer journey. This analysis helps us understand at which stages potential customers drop off and what actions we can take to improve the process.
For instance, by tracking the conversion rate at each step, from lead generation to initial contact, from qualifying leads to proposing solutions, and finally to closing the sale—we can pinpoint specific areas where improvements are needed. If the conversion rate between the initial contact and the qualification stage is low, it may indicate that our initial communications are not effectively targeted or engaging enough. Conversely, a drop in conversion rates at the proposal stage might suggest that our solutions are not aligning well with customer needs or expectations.
We use this analysis to refine our targeting strategies, adjust our messaging, and even reevaluate the solutions we offer. For example, if we find that conversion rates are higher among a particular demographic or industry, we might focus more of our marketing efforts in these areas. Additionally, understanding where leads fall off helps us to tailor our nurturing campaigns more effectively to maintain interest and engagement throughout the sales process.
For these reasons, it is important to establish clear metrics for each stage of the customer journey and conduct regular reviews of these metrics. Use data-driven insights to adjust your strategies continually, focusing on improving weak areas that could significantly impact overall conversion rates. This ongoing analysis not only boosts efficiency but also enhances the overall effectiveness of marketing campaigns, leading to better sales outcomes and higher customer satisfaction.
Balance CAC and LTV ratio for better economics
Balancing Customer Acquisition Cost (CAC) with Customer Lifetime Value (CLV) is pivotal for ensuring sustainable marketing efforts and long-term business viability.
Customer Acquisition Cost (CAC) is the total cost of acquiring a new customer. This includes all expenses involved in marketing and sales efforts that contribute directly to acquiring customers, divided by the number of customers acquired during that period. For instance, if CodeDesign spends $10,000 on marketing in a month and acquires 100 new customers, the CAC would be $100 per customer.
Customer Lifetime Value (CLV), on the other hand, is the total value a business expects to realise from a customer throughout their relationship with the company. It is calculated by multiplying the average purchase value by the number of purchases a customer makes in a year and the average customer relationship length in years. For example, if a customer spends an average of $200 per purchase, makes five purchases per year, and is typically a customer for three years, the CLV would be $3,000.
Balancing CAC against CLV involves ensuring that the cost of acquiring a customer does not exceed the value that the customer generates over the lifespan of their relationship with the company. A healthy ratio of CLV to CAC is generally considered to be 3:1, meaning the customer lifetime value should be three times the cost of acquiring the customer. This ratio ensures that the company profits from each customer, thereby sustaining marketing efforts and business growth.
When we partner with our clients, we rigorously monitor both metrics to fine-tune our marketing strategies. For example, if we notice an increase in CAC due to rising ad costs but CLV remains stagnant, we may explore more cost-effective channels or improve customer retention strategies to enhance CLV. This could involve implementing loyalty programs, improving customer service, or offering upsells and cross-sells to increase the frequency and value of purchases.
Heat maps and funnel visualisation would help have more data
Heat maps and funnel visualisations are invaluable tools in identifying bottlenecks and optimising the conversion process, crucial for enhancing the effectiveness of digital strategies at CodeDesign. These tools provide visual representations of how users interact with a website or app, offering clear insights into behaviour patterns that text-based analytics alone might miss.
Heat Maps show where users click, move their mouse, scroll, and spend time on a page. Colours ranging from hot to cold (red to blue) indicate areas of high to low activity. This visualisation helps identify which parts of a page attract the most attention and interaction, and which are ignored. For example, if a crucial call-to-action (CTA) button is in a "cold" area, it’s likely not catching users' attention as intended, signalling a need for design changes.
Funnel Visualisations trace the step-by-step journey users take through a predefined conversion path, such as from landing page to checkout. They highlight the number of users progressing through each step and, importantly, where users drop off. A significant drop-off after adding items to a cart but before completing a purchase could indicate issues with the checkout process, such as an overly complicated form or unexpected costs.
CodeDesign Augmented Analytics Tool

CodeDesign's Augmented Analytics tool is an advanced, AI-powered platform designed to enhance the way businesses handle data analysis, decision-making, and online customer interactions. The tool uses machine learning and artificial intelligence to assist in data preparation, insight generation, and explanation. This means it not only helps you collect and organise data but also makes sense of it by identifying key patterns, trends, and anomalies. This is particularly useful for businesses that require actionable insights but may not have the in-house expertise to delve deep into complex data analysis.
Our tool enables an enhancement in overall user experience
Real-time tracking capabilities provide a live view of every visitor on your website. This feature is integrated directly into your website's analytics, making it easier to access and interpret visitor data without switching between platforms. The built-in URL shortener with detailed metrics further simplifies tracking and analysing specific marketing campaigns or content performance.
The tool includes heatmaps segmented by various criteria such as goals, A/B tests, and visitor sessions. These heatmaps are invaluable for understanding how users interact with different elements of your website, which helps in optimising layout and content for better user engagement. Additionally, uptime monitoring and speed loading monitoring ensure that your website performs optimally at all times
Dynamic Goal Tracking
Unlike traditional analytics tools that require predefined goals, CodeDesign's tool allows for dynamic goal setting. This means you can track conversions and other key metrics even if they weren't set up initially. The tool's capability to track visitors who have disabled JavaScript ensures that you don't miss out on any data, providing a complete picture of user behaviour. Based on the data processed, the tool can identify areas of improvement and suggest optimizations. It can even alert you to potential performance issues before they impact your website, allowing for proactive management.

About Bruno GavinoBruno Gavino is the CEO and partner of Codedesign, a digital marketing agency with a strong international presence. Based in Lisbon, Portugal, with offices in Boston, Singapore, and Manchester (UK) Codedesign has been recognized as one of the top interactive agencies and eCommerce agencies. Awarded Top B2B Company in Europe and Top B2C company in retail, Codedesign aims to foster personal relationships with clients and create a positive work environment for its team. He emphasizes the need for digital agencies to focus on data optimization and performance to meet the increasingly results-driven demands of clients. His experience in digital marketing, combined with a unique background that includes engineering and data, contributes to his effective and multifaceted leadership style. |

About CodedesignCodedesign is a digital marketing agency with a strong multicultural and international presence, offering expert services in digital marketing. Our digital agency in Lisbon, Boston, and Manchester enables us to provide market-ready strategies that suit a wide range of clients across the globe (both B2B and B2C). We specialize in creating impactful online experiences, focusing on making your digital presence strong and efficient. Our approach is straightforward and effective, ensuring that every client receives a personalized service that truly meets their needs. Our digital agency is committed to using the latest data and technology to help your business stand out. Whether you're looking to increase your online visibility, connect better with your audience, get more leads, or grow your online sales. For more information, read our Digital Strategy Blog or to start your journey with us, please feel free to contact us. |
CodeDesign is leading:
- Digital Agency
- Digital Marketing Agency
- Digital Ecommerce Agency
- Amazon Marketing Agency

Add comment ×