6 min to read
IMPORTANT INFORMATIONLike all forecasting tools and data models, proper research and experience are critical to create an accurate Digital Marketing Plan. |
Why Analytics is the Key for Success in Ecommerce
If you own a business or are involved in the management of one then you are more than likely using your website for Ecommerce purposes.
This means that your customer journey differs from that of a traditional businesses, as you no longer have the physical touch or human sales element.
This is a challenge for you as a digital marketer because you must bridge this gap by effectively engaging with your users digitally, through a computer screen.
This requires constant measuring and analysis of your users behavior. You should always be trying to understand why users engage with your website like they do, in order to get positive results and increase your Ecommerce revenue.
So, how do you find out the number of users have looked at your products against how users people made a purchase? Or, how many customers abandoned their carts, and at which stage of the purchasing process did users leave the most?
By reading this article you will learn every feature of the Enhanced Ecommerce Plugin, and how to can apply it to your Ecommerce's analytics to increase your goal conversion rates and ultimately increase your revenue.
Enter The Enhanced Ecommerce Plugin for Google Analytics
You can access the valuable metrics discussed above, and more by implementing the Enhanced Ecommerce Plugin for Google Analytics.
This is the what we use for our eCommerce clients- especially those with large product catalogues and frequent promotions. We'd be remiss if we didn't credit this tool with helping us get ranked as one of the Top eCommerce Consulting Companies.
The Enhanced Ecommerce plugin allows you to measure both your users shopping behavior and checkout behavior. This enables you to compare each step of your customer's buying journey. By comparing each step, you can pinpoint which area of the sales funnel your Ecommerce is excelling in, and the stages that need improvement.
Once you have optimized your sales funnel, your CTR and revenue will reach new heights.
Tip: Once you have located the areas of your customers' journey that need attention, use Google Optimize to help test and implement different solutions.
How Enhanced Ecommerce Differs to the Traditional Ecommerce Plugin
Enhanced Ecommerce allows you to use multiple new data types to measure your users behaviour and engagement. The data types that you can access are as follows:
- Impression Data,
- Product Data Measures,
- Promotion Data,
- Action Data.
Currently you have access to five different Ecommerce reports in google analytics. They are as follows:
- Ecommerce Overview,
- Product Performances,
- Sales Performance,
- Transactions,
- Time to Purchase reports.
By enhancing your Ecommerce you gain access to ten reports, some are similar to the original plugin however upgraded with more insightful data.
The 10 Enhanced Ecommerce Reports
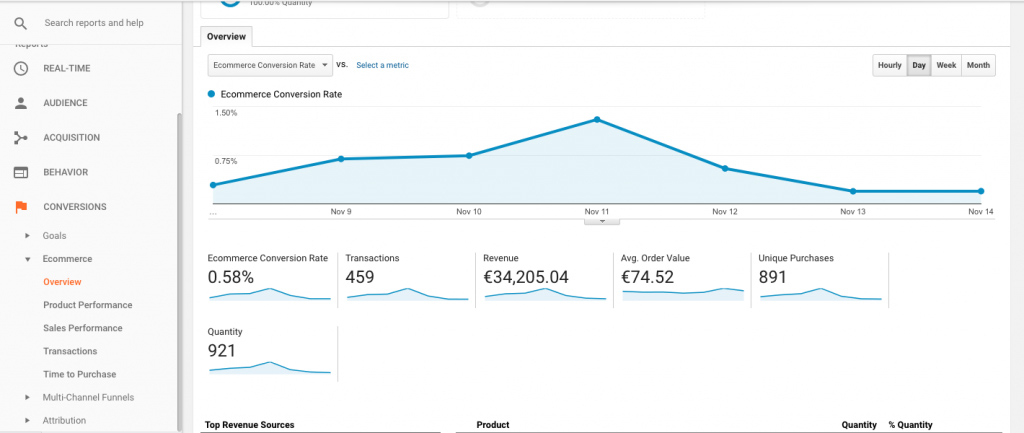
1. Ecommerce Overview:
An overview of your most important metrics at a glance.
2. Shopping Behaviour Analysis:
Measures the number of sessions that occur at each stage of your purchase funnel, how many users then proceeded to the following step, and the amount of sessions that were abandoned in the funnel at each stage.
3. Checkout Behaviour Analysis:
Measures how smoothly your users are moving through your checkout process. The checkout-funnel shows you how many users moved from one step to the other, the amount of users that abandoned the process from each step to the next, and how many entered the process at each step.
4. Product Performance:
This report is very clever. It gives you insight into how your product is performing from two different perspectives.
- Summary: This gives you an overview of your products sales performance such as revenue, unique purchase and product refund amount.
- Shopping behaviour: Shows you metrics on how your users are engaging with your products such as product views, product details views, the amount of times a product has been added and removed from a shoppers cart, and completed checkouts.
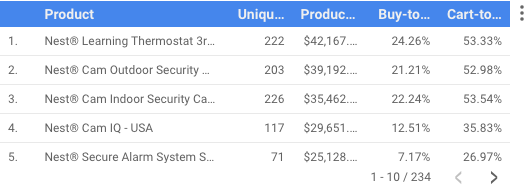
Tip: The most useful metrics are cart-to-detail rate (number of products added to cart per number of product-detail-views) and buy-to-detail rate (number of products purchased per number of product detail views). These can be applied to your data studio's product table so you can see which products are underachieving and which are achieving better than expected. From here, you can figure out why (check the example below).
5. Sales Performance:
Through the sales report you can analyze sales through two different dimensions. Transaction (date, time, traction ID) or date (cumulative transaction data by date). Metrics include; Revenue, Tax, Shipping (Total charges for Ecommerce transactions), Refund Amount, and Quantity (number of units sold).
6. Product List Performance:
Allows you to group your products together, based on your ec.js tagging: e.g. catalog pages, up-sell blocks, cross-sell blocks and related-products blocks. This allows you to see and compare how your product lists are performing on your site using the following metrics; product list views, product clicks and product list CTR.
7. Internal Promotions:
Gives you information on the internal promotions of your website, for example banners that are promoting other areas of your website. You can see how many impressions they get and how many people clicked on the promotion.
8. Order Coupon:
Enables you to measure how successful your order coupons are. Enhanced Ecommerce quantifies this by revenue generated, transactions and average value (per Ecommerce transaction).
9. Product Coupon:
Enables you to measure how successful your order coupons (discount codes) are. Enhanced Ecommerce quantifies this by revenue generated, unique purchases and average product revenue per purchase.
10. Affiliate Code:
This report measures how much your affiliate sites are contributing to the performance of your Ecommerce. This is illustrated through revenue, transactions and average order value.
For additional resources on implementing Enhanced Ecommerce, check out our User's Guide.
Enhanced Ecommerce linked with Google Data Studio
You can then link your Enhanced Ecommerce analytics with your Google Data Studio account to create ecommerce buyer behaviour reports.
Google Data Studio consolidates all your data into one report to tell a story to your business's stakeholders.
To learn more about Google Data Studio, check out the User's' Guide: Google Data Studio Template for Ecommerce Report.
By inputting this information into data studios, you can make more informed decisions and better illustrate your evidence to support your solutions when explaining them to your stakeholders.
How Using Our Buyer Behaviour Data Studio Can Improve Your Ecommerce
Shopping Behaviour Analysis
The shopper behavior funnel gives you metrics on the step-by-step process of your consumer's purchasing process.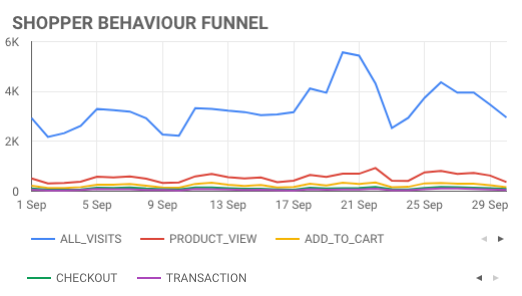
Each series line represents a movement in the purchasing process, starting with all visits and ending with the final transaction.
Using a time series graph enables you to see any anomalies or weaknesses across a period of time. It is also easy to compare the different stages of the funnel. From this graph you can easily pinpoint which stage is ineffective, then test various different solutions to improve that stage. Implemented correctly, these changes will raise your CTR and Conversion Rates.
Checkout Behaviour Analysis
Similar to the Shopping Behaviour Funnel, the Checkout Behaviour Funnel graphically represents consumers movements between different checkout stages.
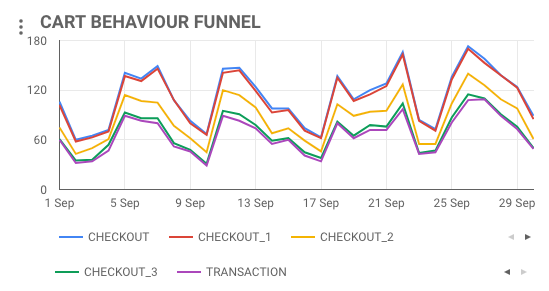
Checkout, Checkout_1,… and Checkout_3 will vary between businesses, the checkout stages for an Ecommerce tend to be:
- Billing
- Shipping
- Payment
- Review
- Transaction
By using a Cart Behaviour Funnel you can get insight into which stage your consumers abandon the checkout procedure. This is invaluable information for figuring out WHY they are dropping out.
Some common reasons for this are:
- Unexpected shipping costs
- A complicated checkout process
- Website checkout not looking trustworthy or secure
- Poor mobile checkout experience
- Couldn’t find where to input the coupon code
Once you have figured out the “why” then you can address the problem and fix it through testing various solutions using Google Optimize. This will make your checkout process more efficient and more user friendly.
Working Example
Here is a working example to really drive home how valuable enhanced ecommerce analytics can be for your website.
Chill Clothing Co. is a Company that sells hip clothes that are targeted towards millennials and the young, trendy demographics. They sell entirely online and have become increasingly popular in recent years.
Chill Clothing Co. noticed that a high quantity of their users were clicking ‘proceed to checkout’ but were not making it to the ‘thank you for your order’ page. This was damaging their goal conversions and revenue, so they decided to investigate this further. Once collected, the company exported this data into Google Data Studios so that they could visually see each stage of the shopping cart procedure in order to pinpoint where the problem was occurring.
From the Enhanced Ecommerce data presented in the data studio it was obvious that the payment stage was ineffective.
However they didn’t stop there!
Once they had found the problem Chill Clothing came up with an idea to why this was happening. They decided that their consumers didn’t feel their payment step was secure enough to proceed.Chill Clothing Co. added more payment options such as paypal to the payment step in order to make their customers feel more confident.
As solutions are only educated guesses they must be tested using Google Optimize. After performing a simple A/B test their intuition was in fact correct and their exit rates on the ‘test payment’ were substantially lower than that of the original page. Thus, their solution was implemented permanently, assisting in an overall increase in conversion rate.
Download your FREE Template to Get Started


Add comment ×